There are many fewer uncommon food words than simply uncommon words, therefore our graph is more granular, but the data were analyzed in the same manner, with a rolling average across a window of five thousand words.
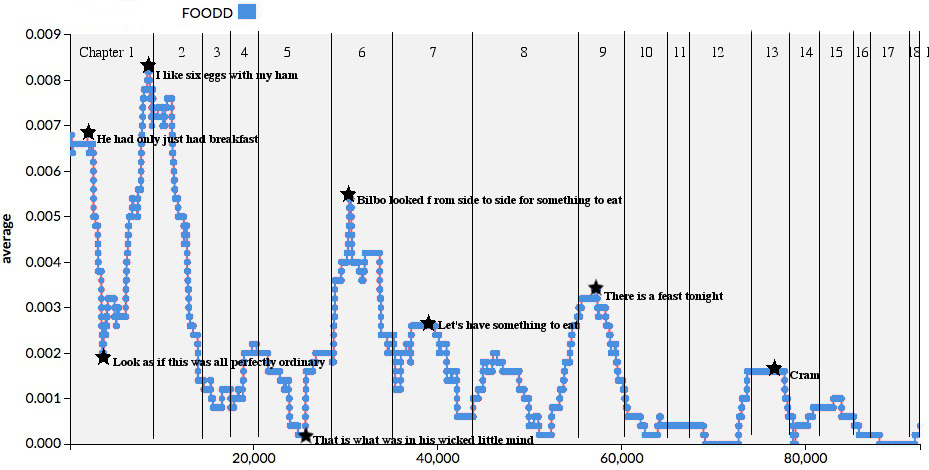
Our y-scale – average number of food words – is much smaller than the scale for the uncommon words. It doesn’t even reach 0.01, and we talked about all common words being around 0.04 in Chapter 1. Clearly if we scrunched the food words down to the same scale as all the uncommon words, we would barely notice their line. So that we can see variation in food words, we’ll keep the graph at the same size as we superimpose it on the overall uncommon words.
To find my list of food words, just follow the “food” tag or click here.
I know for a fact the chicken and apples are in the Ten Thousand most common words – I challenge my fellow scholars to tag and analyze all the food words of The Hobbit!
